
Notes on Everything I Ever Learnt About JVM Performance Tuning at Twitter
Watching Attila Szegedi, Everything I Ever Learned About JVM Performance Tuning at Twitter
Attila Szegedi, Everything I Ever Learned About JVM Performance Tuning at Twitter
Plumbr.io, Minor GC vs Major GC vs Full GC - https://plumbr.io/blog/garbage-collection/minor-gc-vs-major-gc-vs-full-gc
(I was inspired to learn more about Java memory when my colleague was able to solve a memory leak issue with one of our apps. Embarrassingly, I had no idea how to resolve the issue, which was as simple as taking a heap dump, increasing swap to be able to read the heap dump, then profiling the heap dump in IntelliJ)
Latency
The biggest problem of any web service is latency
The biggest killer of latency is garbage collection
Memory tuning:
Memory footprint tuning
Allocation rate tuning
Garbage collection tuning
The fastest GC is the GC that didn't happen 😆
If you have an out of memory error (Memory footprint tuning):
Too much data
Data representation is fat
Memory leak
Too much data:
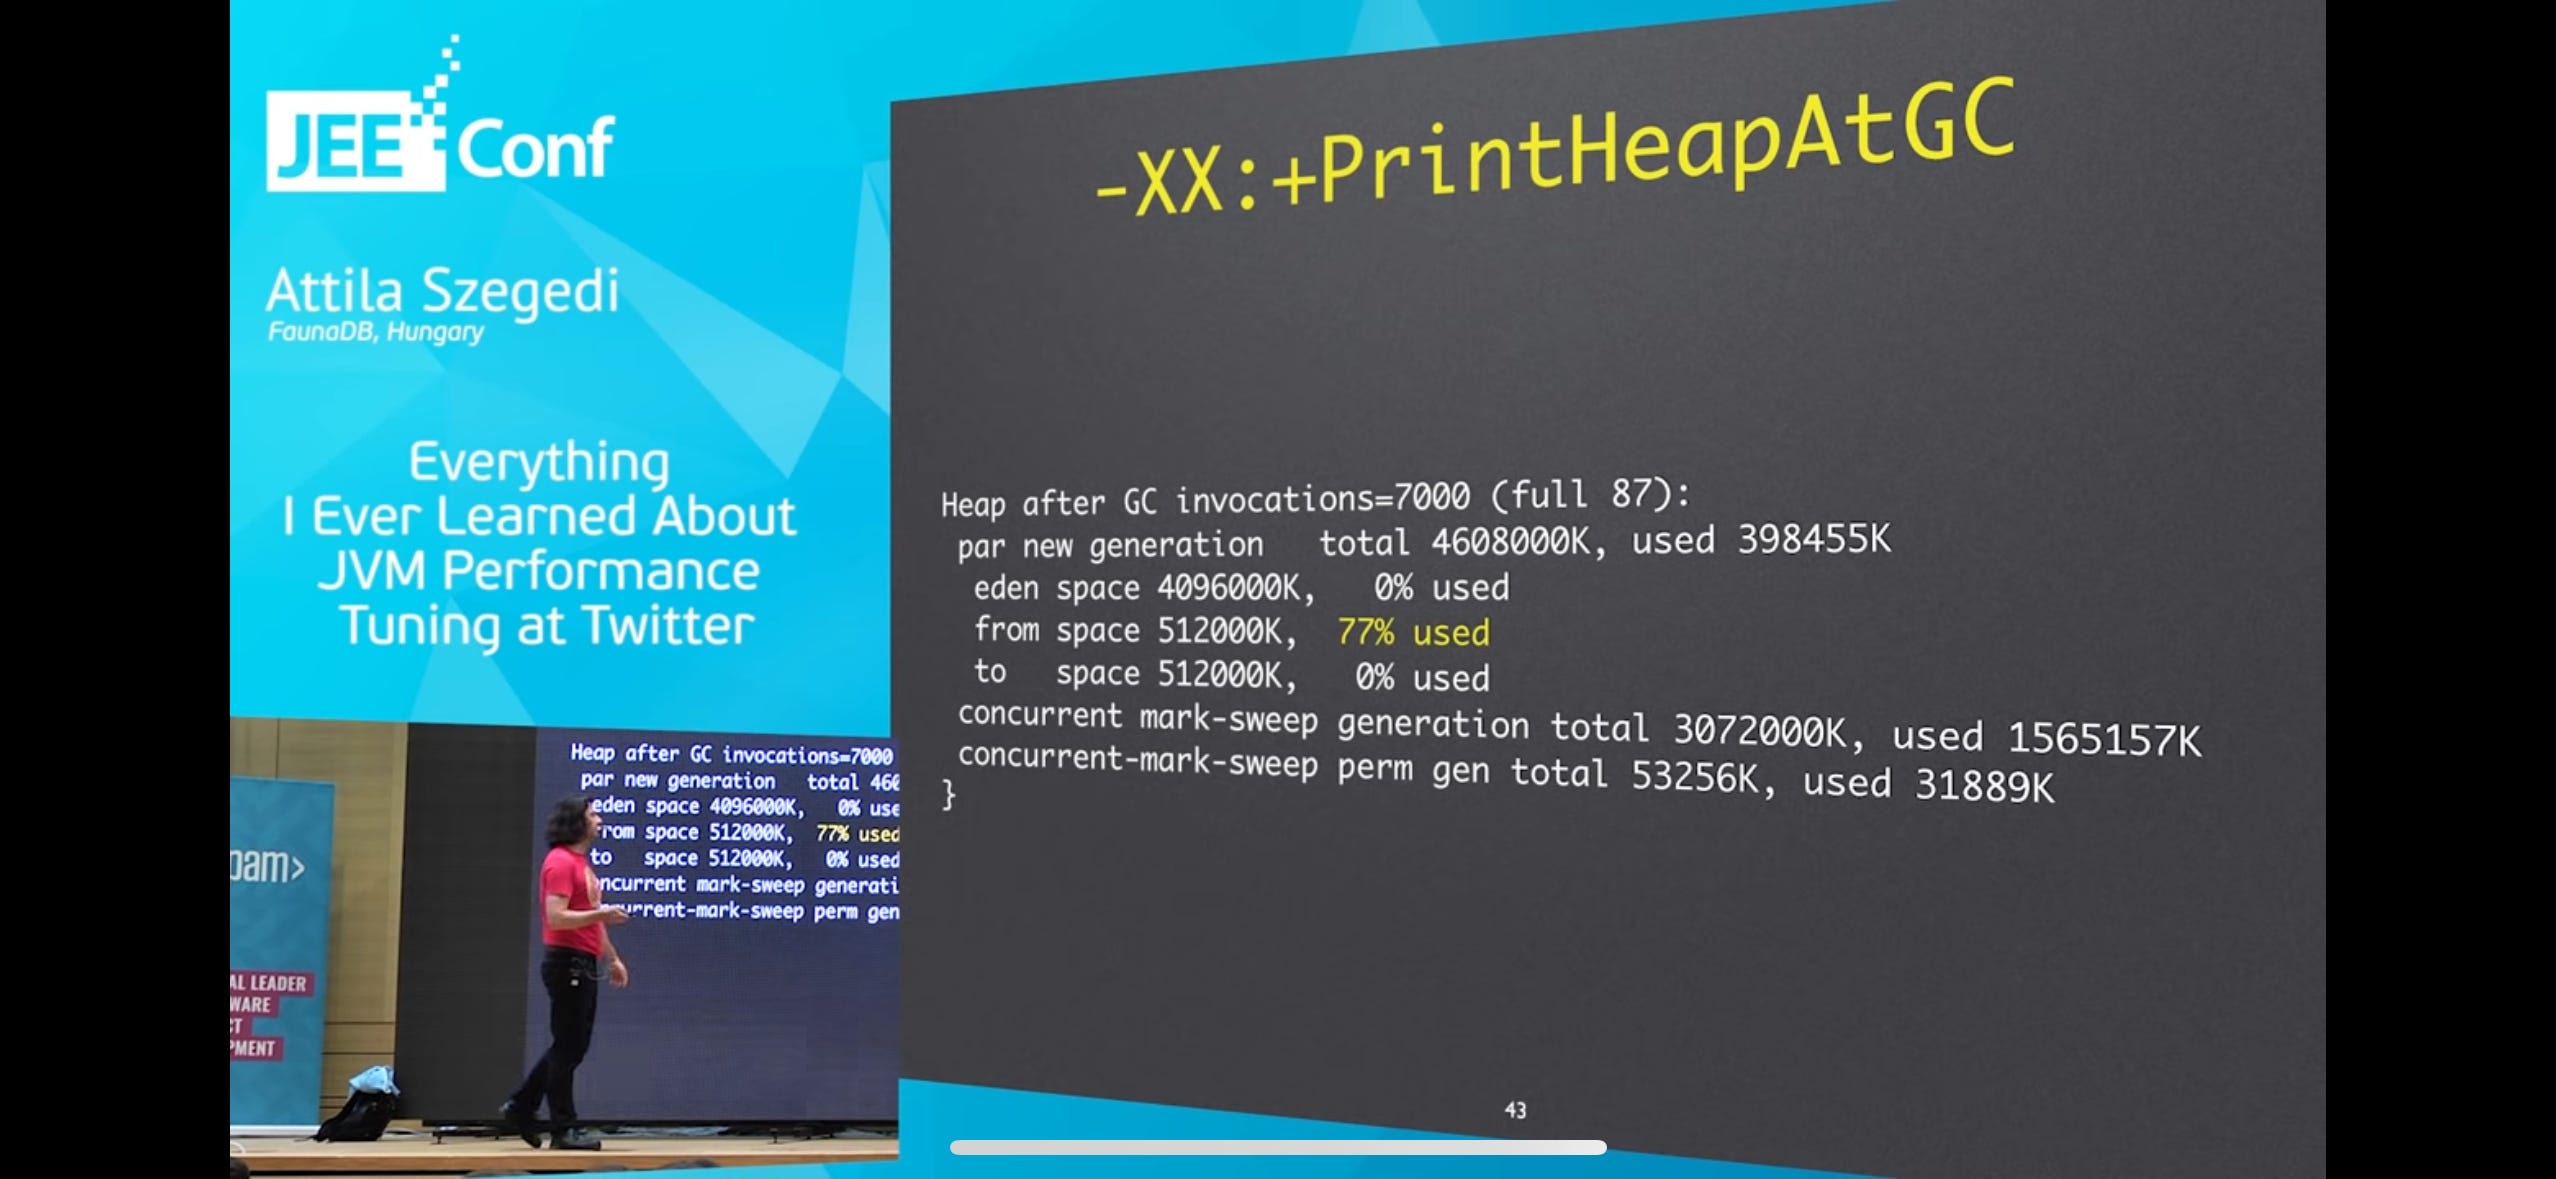
Run with -verbosegc
Observe numbers in "Full GC" messages (Question: Is it a good idea to turn this on in Prod?)
[Full GC after($total), $time secs]
Give JVM more memory?
Do we need all the data?
LRU (Least Recently Used) cache
Add items to cache with timestamp
On hit, update timestamp
On miss, add to cache replacing item with oldest timestamp
Soft references (Question: What are soft references?)
If data is cheap to reload/recompute, use LRU cache
Fat data
Generally not a problem
Unless you have a weird use case like loading the whole Twitter social graph into a single JVM (very large scale)
Compressed object pointers
Don't understand how they work, but basically its a trick with padding which allows a 32-bit pointer to address 32GB of memory instead of 4GB
32GB heap size, have to use uncompressed pointers, "uncanny valley" of performance between 32GB and 42-48GB
Tradeoffs
Latency (responsiveness) and throughput tradeoff:
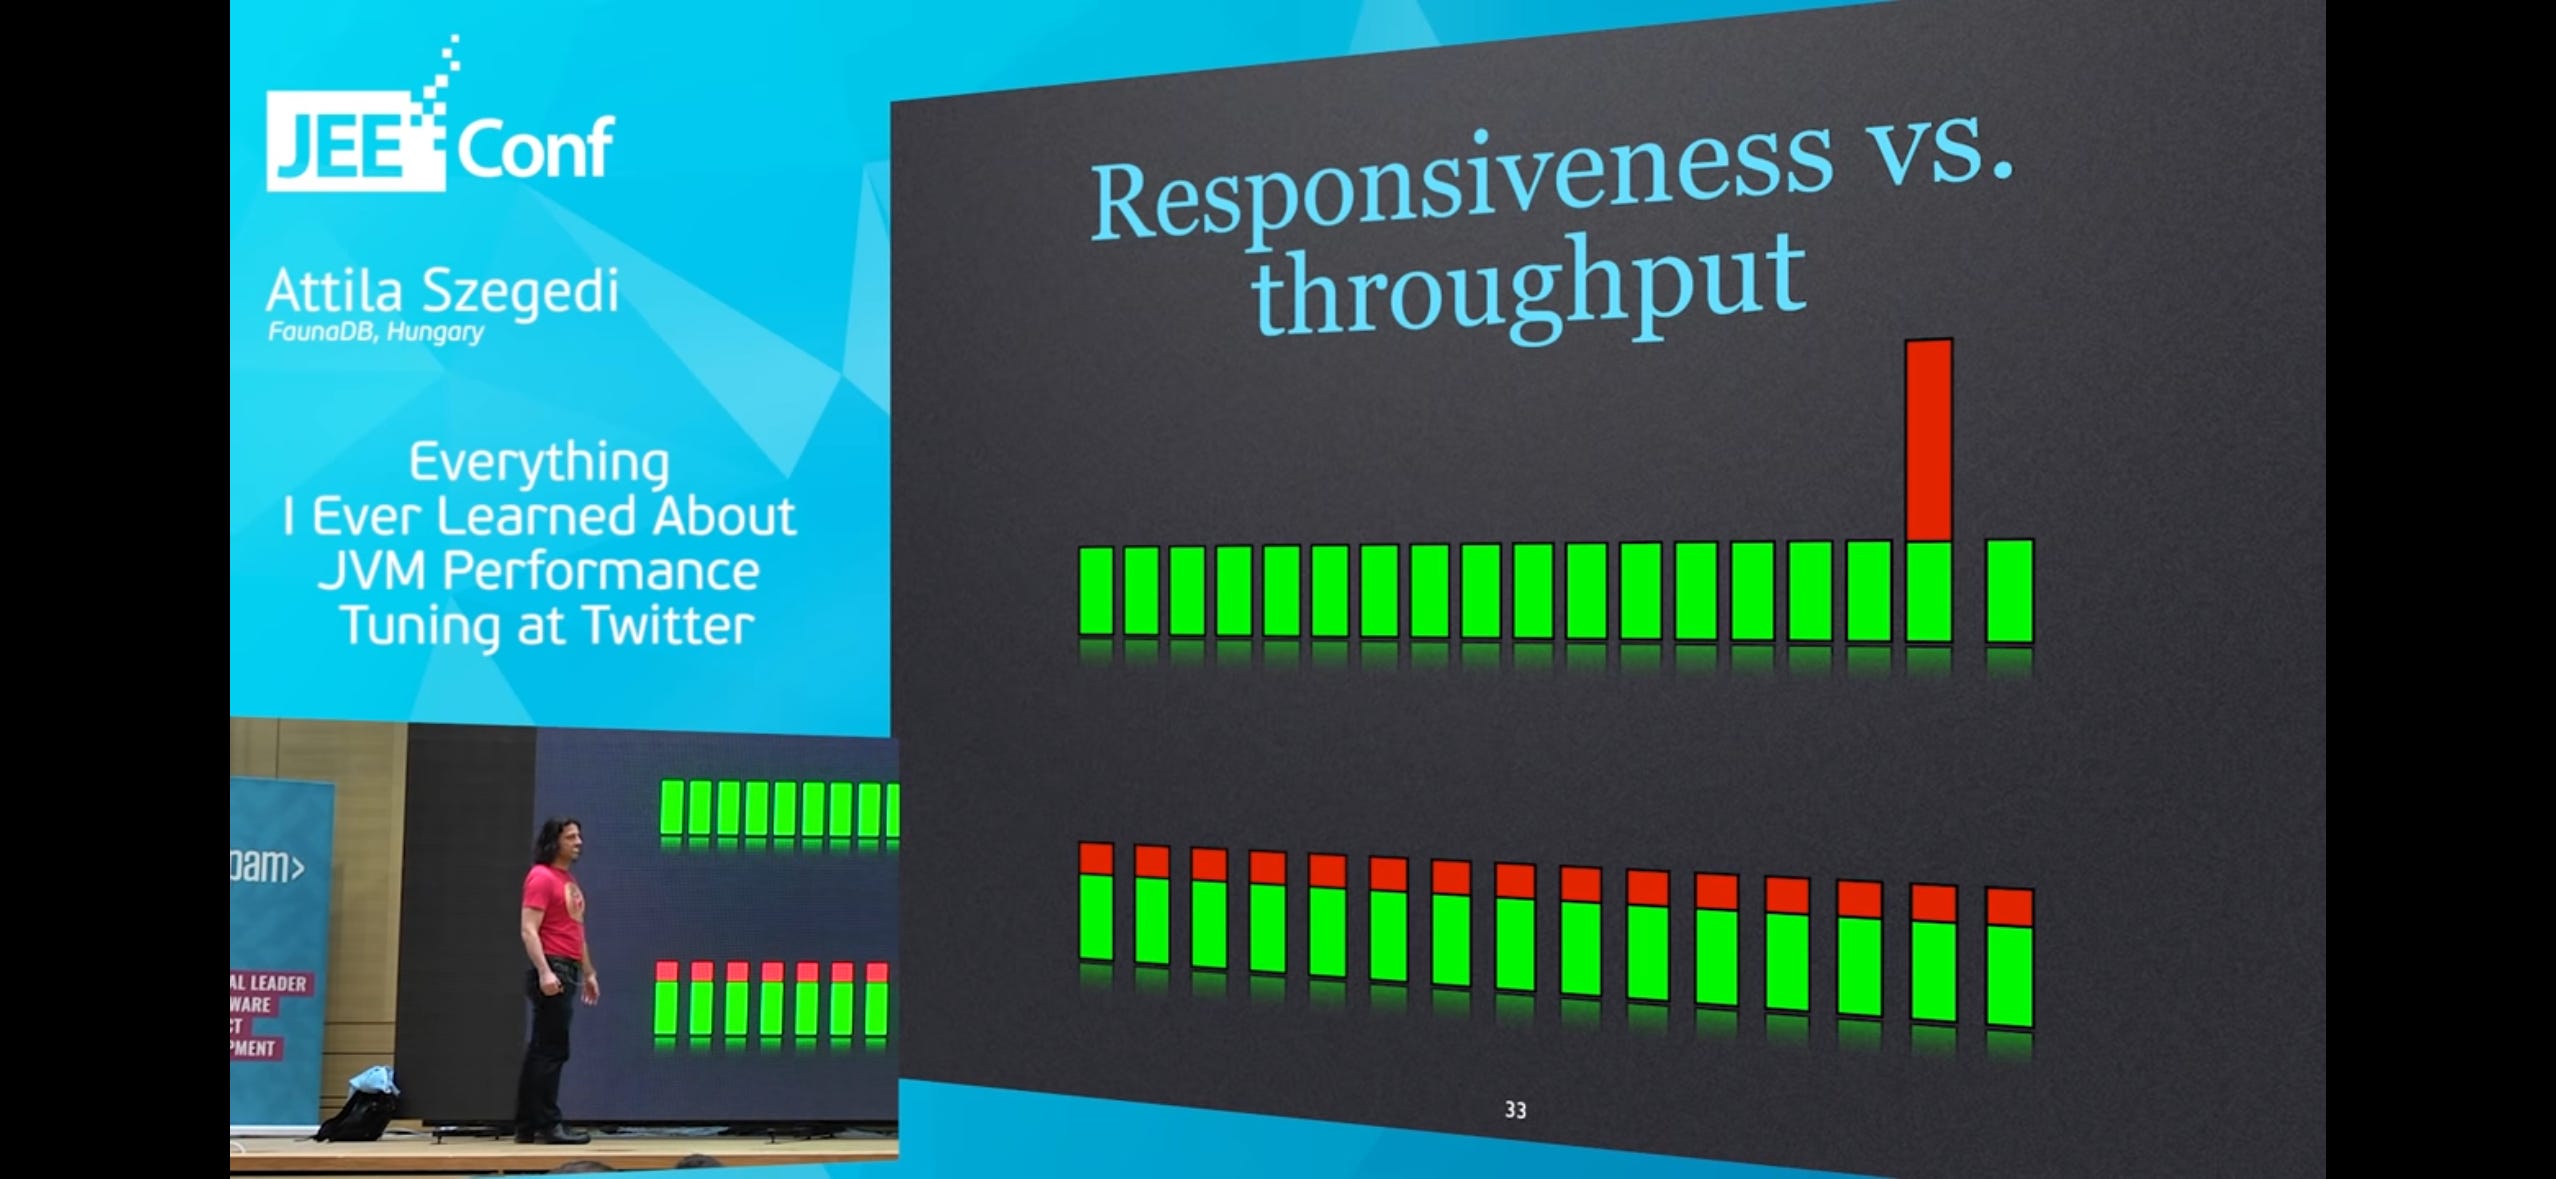
Top is optimising for throughput (more densely packed), bottom is optimising for latency (no massive spike in latency)
Top is preferable for "bulk" applications
Bottom is preferable for web applications
Garbage Collection kills latency/throughput
Heap is divided into Eden, Survivor, Old spaces
Eden and Survivor Spaces:
All new allocation happens in Eden space
Cheap, only costs a pointer increment (since new objects are allocated memory in Eden space sequentially)
When Eden space is full, Stop the World GC (minor), tends to be fast since Eden space is smaller, most objects are considered garbage and not copied (deleting i.e. not copying is free)
Mark and Copy in Eden and Survivor spaces (no fragmentation), instead of Mark, Sweep, and Compact
Objects in Survivor spaces are moved back and forth between S1 and S2 until they reach a certain "age" and are tenured into Old Generation
Pointer in each space is reset with each GC
Old Generation garbage collection algorithms can be selected with parameters, favouring throughput or latency
GC Tuning
(I'm basically copying and pasting the points, I don't understand what's going on here 🙃)
Always start with young generation (Question: Why?)
Watch the tenuring threshold, might need to tenure long lived objects faster
If 100%, too many long-lived objects in first Survivor space + new stuff from Eden space to fit in second Survivor space, forcibly tenured
Watch tenuring distribution

Age should be declining sharply, otherwise memory load is increasing, either app is starting up or memory leak
Try using Concurrent Mark and Sweep (Question: What is Concurrent Mark and Sweep?)
Didn't get any "Full GC" messages? You're done!